
Business intelligence (or as commonly known as BI) helps businesses predict and analyze the variety of needful information: what discount and marketing campaigns have really resonated with customers (and, obviously, which have not), what products should be put in the spotlight and which ones are to be omitted, etc. In 2016 the business intelligence industry showed some great results, so no wonder it has bloomed in 2017. As the BI landscape is evolving at a fast pace, it’s important to catch up with emerging trends in order to stay competitive.
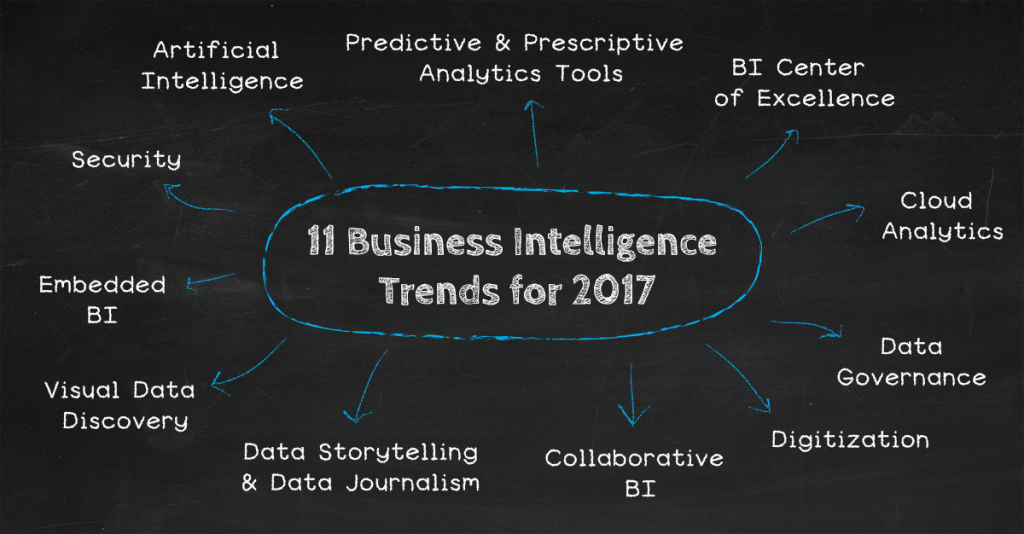
To keep a long story short, business intelligence is slowly but gradually becoming a significant part of the future, so let’s point out some of the latest trends in BI which we’ve observed in 2017.
Security
Security is the major topic for various fields of business. As cybercriminals are becoming more and more tech-savvy and experienced, the importance of adequate security measures is indisputable. Surely, the business intelligence sphere defined by huge amounts of important data is no exception. There have been reports of data breaches and data security issues which includes huge data losses by big names like Compass Bank, AT&T, LinkedIn, Apple and AOL. This way, security is one of the biggest business intelligence challenges in the last years. And it’s not only about international corporations, but the small businesses as well. Their database security has been a hot debate in 2017. Entrepreneurs will be soon searching for some other secure and viable solutions which will prevent the risk of data breach and losses.
Using security analytics, businesses can identify possible threats and enable detection in a timely manner.
As the amount of data generated inside and outside organizations is huge, security analytics helps companies to detect any hidden relationships, identify their patterns and block security threats. Analyzing data from the Internet, smart devices, and social media can help law enforcement detect criminal threats better and collect evidence. Instead of waiting for a cyber-attack, organizations can address it proactively.
Collaborative Business Intelligence
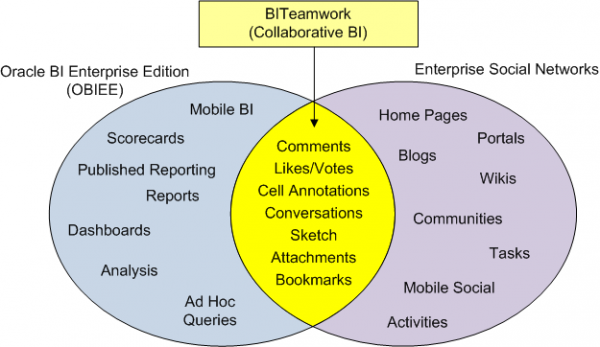
Collaborative BI is a mixture of diverse tools, social media and other 2.0 technologies with BI software. This method makes sharing a lot easier by generating automating reports which can be scheduled at specific times and people. Intelligence alerts, sharing public or embedded dashboards provide a sort of flexible interactivity any business needs. Moreover, all these possibilities are available on various devices which is crucial for increasing the decision-making and problem-solving processes. In 2017 Collaborative Analytics has taken the center stage. Nowadays, managers and co-workers must interact in a new, more effective fashion as the competition is getting tighter and tighter.
Cloud-based or in-house?
This question has arisen several times in the business intelligence world this year. So, again, should it be cloud-based or in-house? The answer depends on a variety of key factors, and the first one to consider is security. The initial question to ask yourself is “What type of information am I planning to store?” For instance, will you entrust your customer data to a third party cloud host?
However, if there’s a need to find a cloud-based host for a company website, security would likely not be a big deal. Another important factor to consider is speed: if your company plans to analyze a high volume of information every day, bandwidth may become an issue. Finally, a cloud-based application will leave almost no space for further customizations. There’s also a difference in prices: cloud-based BI solutions are more affordable than in-house applications.
Visualization
Professionals across the industry agree: the role of visualization in business intelligence is more than important. The Business Application Research Center (BARC) surveyed 2,800 users, consultants, and vendors of business intelligence (BI) for their opinions on the most important trends in BI. According to its results, data visualization is the most significant trend in 2017. However, the question is how to visualize data in a proper manner?
Boris Evelson, Vice President of Forrester Research, details a few helpful tips to help you with that. Ironically, he suggests that before we proceed, we should ask ourselves whether visualization is really necessary to the type of information we’re trying to illustrate. Another key point here is the audience. Are you presenting your findings to executives or data scientists? Regardless of what information you are illustrating, apply best practices like interactive elements: navigation, animation, and icons, for example. Finally, make it your goal to tell a compelling story through your presentation—for example, by using a storyboard or a timeline.
Conclusion
Even though many companies have already used business intelligence services, there is still some incertitude among some companies. It may sound incredible, but 10% of the respondents in Clutch’s survey disagreed with the following statement: “Business Intelligence data is important to my company.” In a modern world where the power of data analysis is growing exponentially, businesses that don’t prioritize self-service BI are giving away a valuable advantage to their competitors.